Insights
Insights and Activity use the same period-aware ledger query, so chart totals
and transaction rows stay aligned.
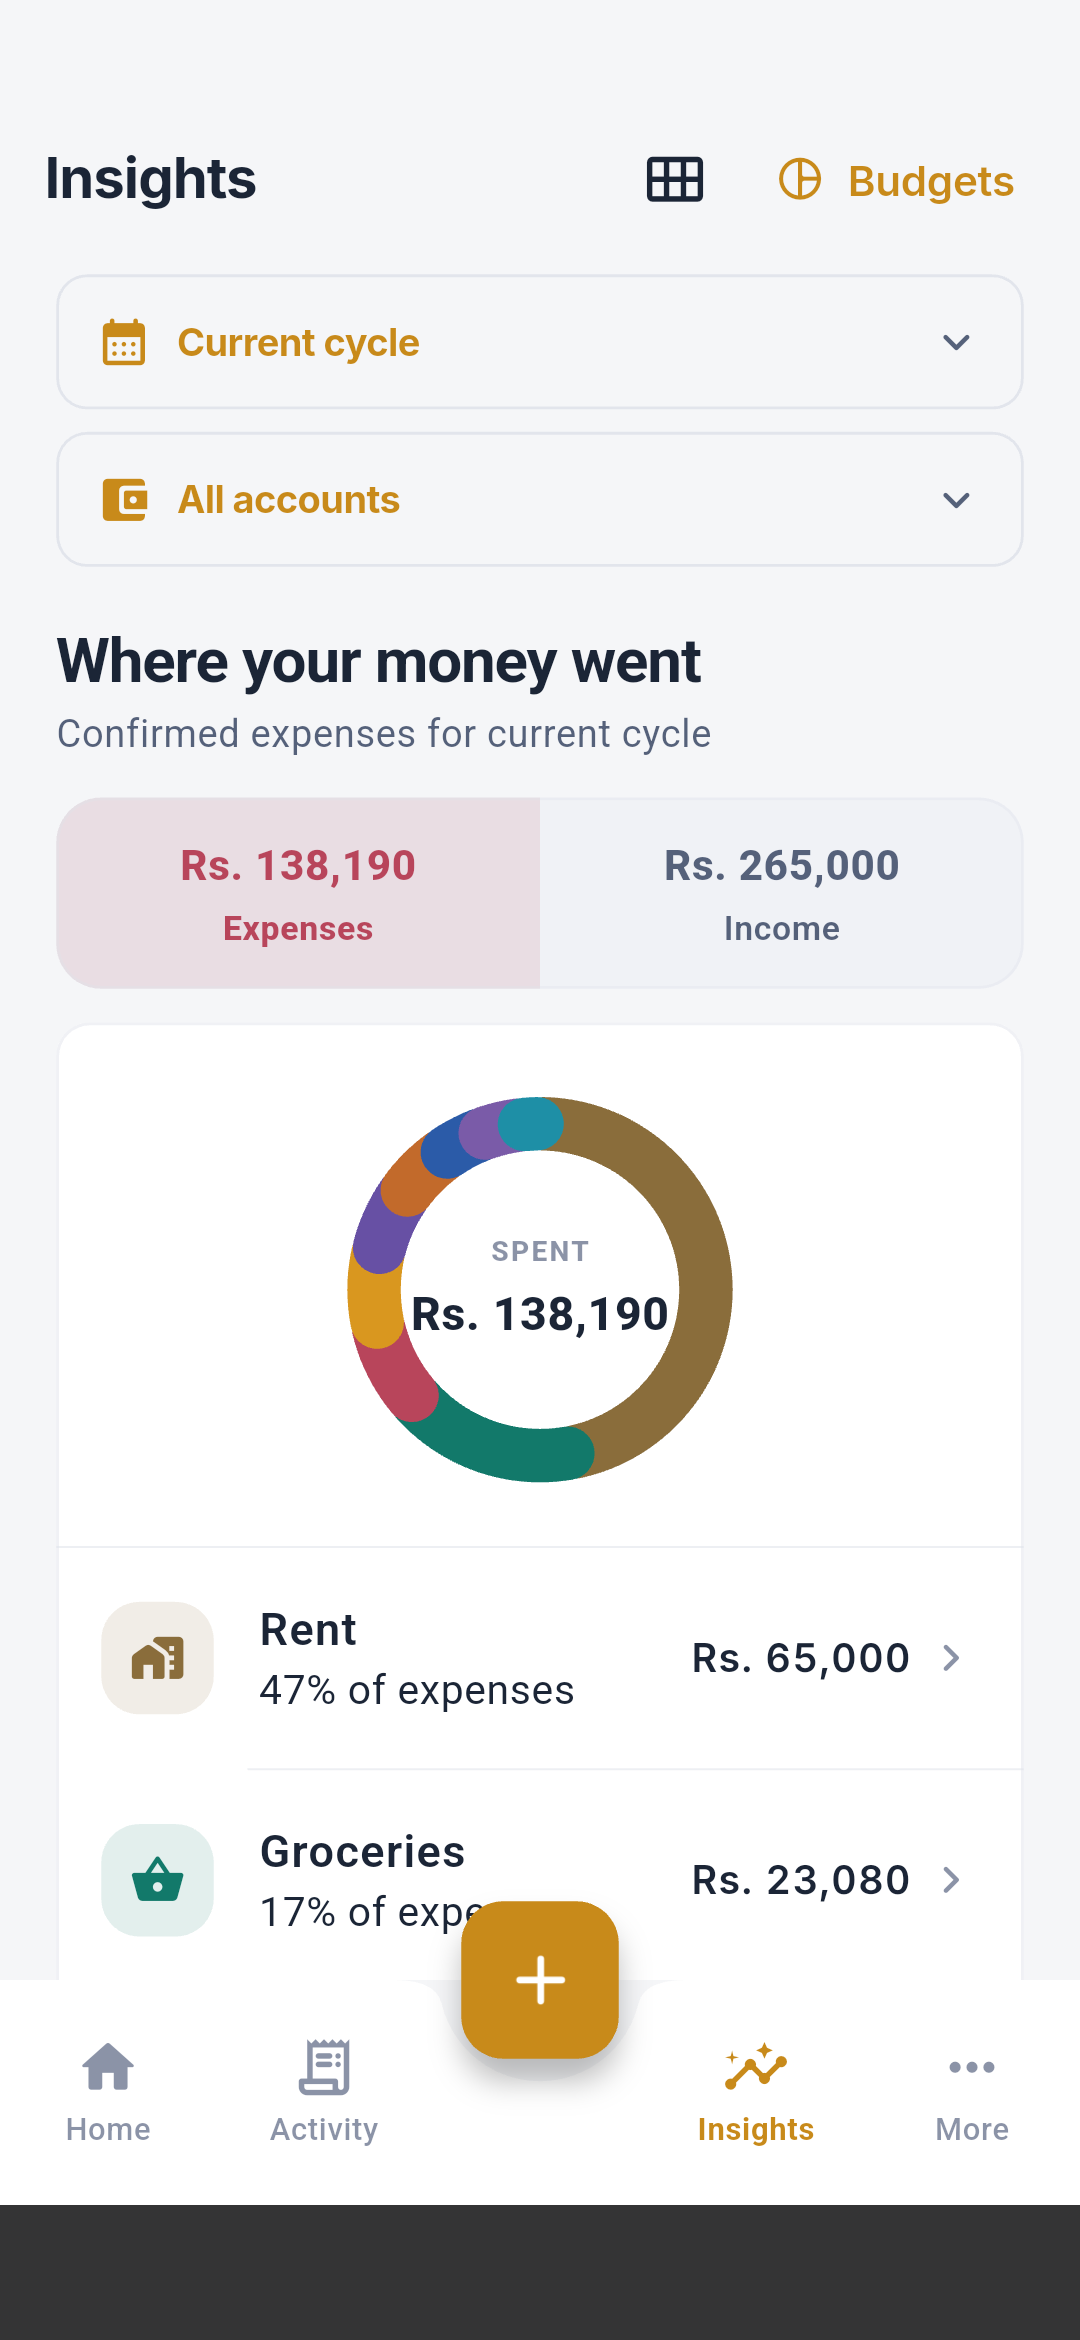
Filters
Choose:
- current payday cycle;
- this week;
- this month;
- this year;
- last 30 days;
- all time;
- an exact custom date range; and
- all accounts, Cash, or one wallet.
Category composition
Switch between Expenses and Income. The chart shows the total and category
share. Tap a category row to open the exact filtered Activity evidence.
Cash flow
Review confirmed income, expenses, and net movement for the period. Transfers
are excluded.
Previous-period comparison
For bounded periods, Salli compares the current window with the immediately
preceding matching window. It shows direction and amount changes and the
largest expense-category driver when available.
Multi-month trends
Choose 3, 6, or 12 months. The chart uses the same account filter and plots
income and expense for each month. Tap a month to open its review.
Categories over time
Select up to three of the available categories to compare monthly spending.
Legend names remain visible and the chart is localized.
If a chart seems inconsistent, use its category or period drill-down. The
resulting Activity list is the exact evidence used for that visual.